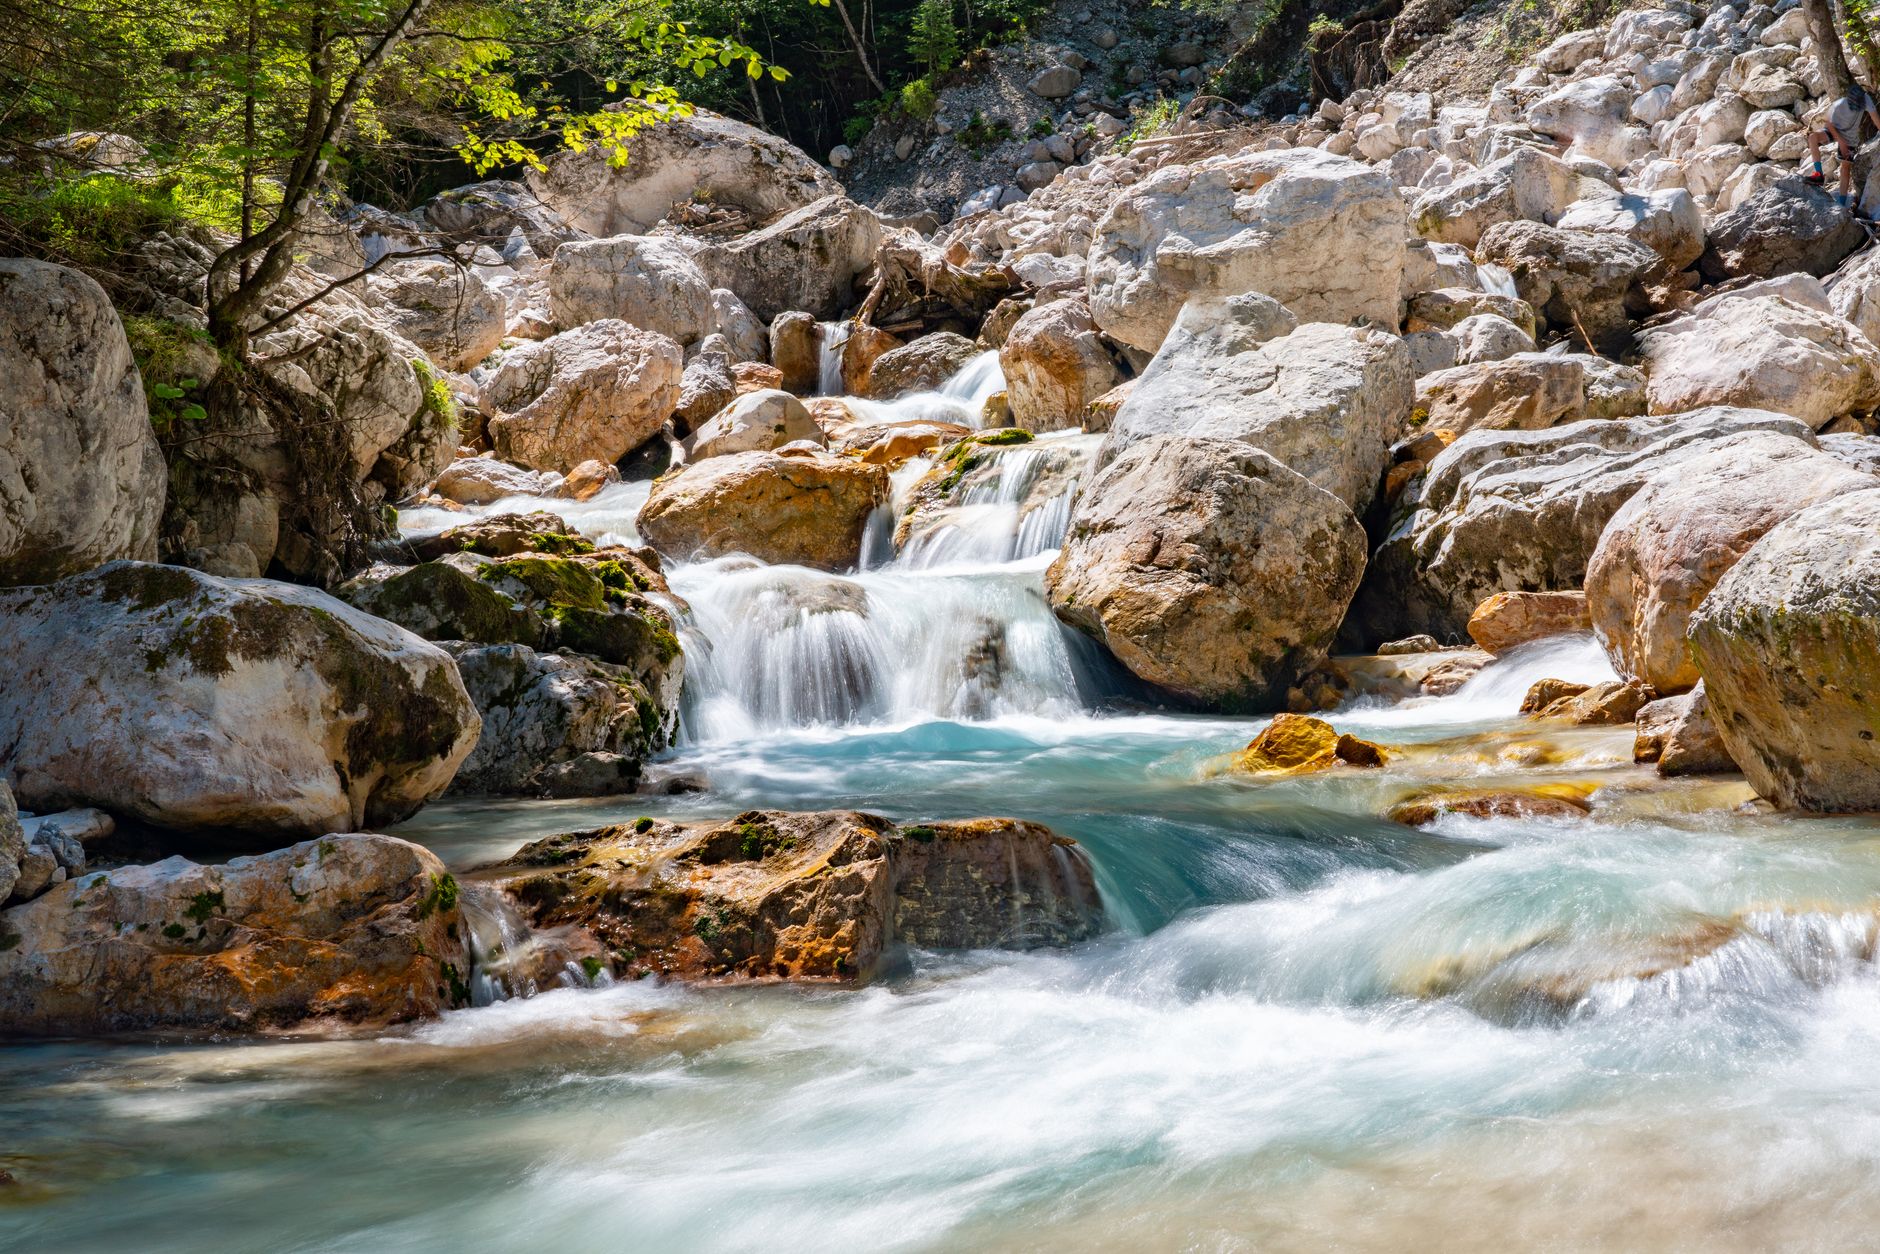
first order
Headwater
A spring seeps out of a hillside and the basin is born.
0.4 cfs
Basin is the open watershed platform — every stream gauge, snow sensor, and groundwater well mapped into one living model of where your water comes from, and where it goes.
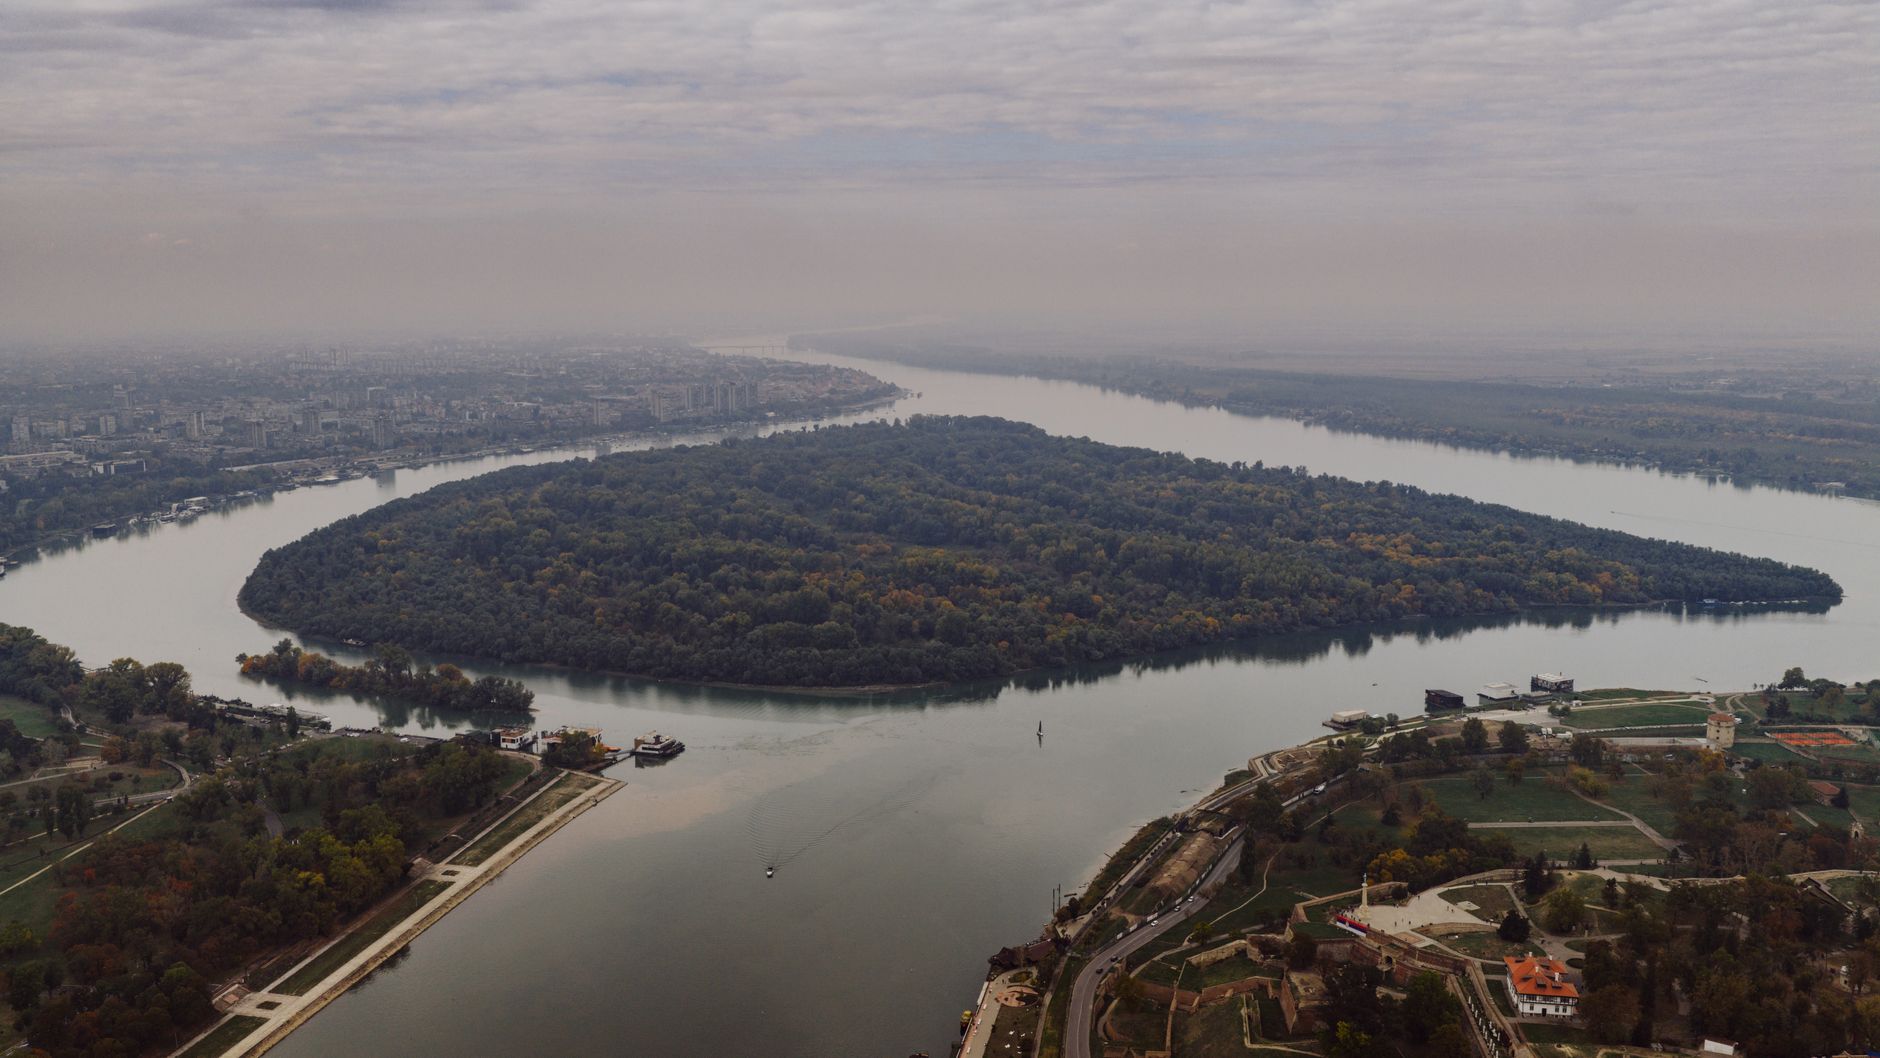
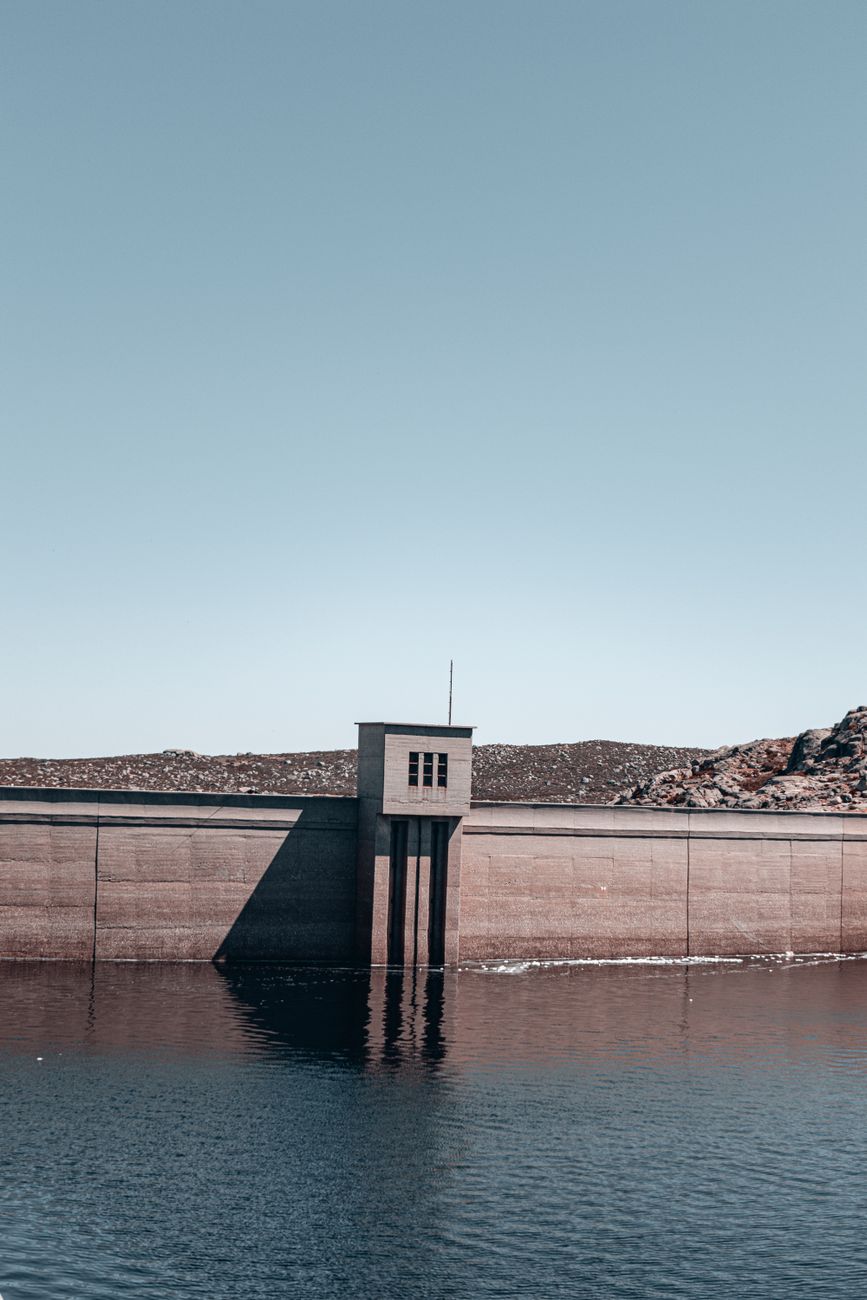
Three steps. No hydrology degree required.
Basin fuses lidar, gauge networks, and satellite imagery into one living map of a watershed — from headwaters to estuary.
Every station reports stage, streamflow, snowpack, and quality in real time, into one open dataset.
Trace any drop from snowmelt to sea, see what's upstream of you, and watch the river answer the weather.
Surface and subsurface, snow to sea.
Thousands of stations reporting stage and flow every fifteen minutes.
Snow water equivalent from satellites and snow courses, all winter.
Wells and aquifers, modeled alongside the surface water they feed.
Turbidity, dissolved oxygen, and temperature from in-river sensors.
Every reading, one JSON endpoint. The data moves as fast as the water.
Anyone can deploy a station. The gaps in the map close fastest from the ground.
Shot where the water actually runs.
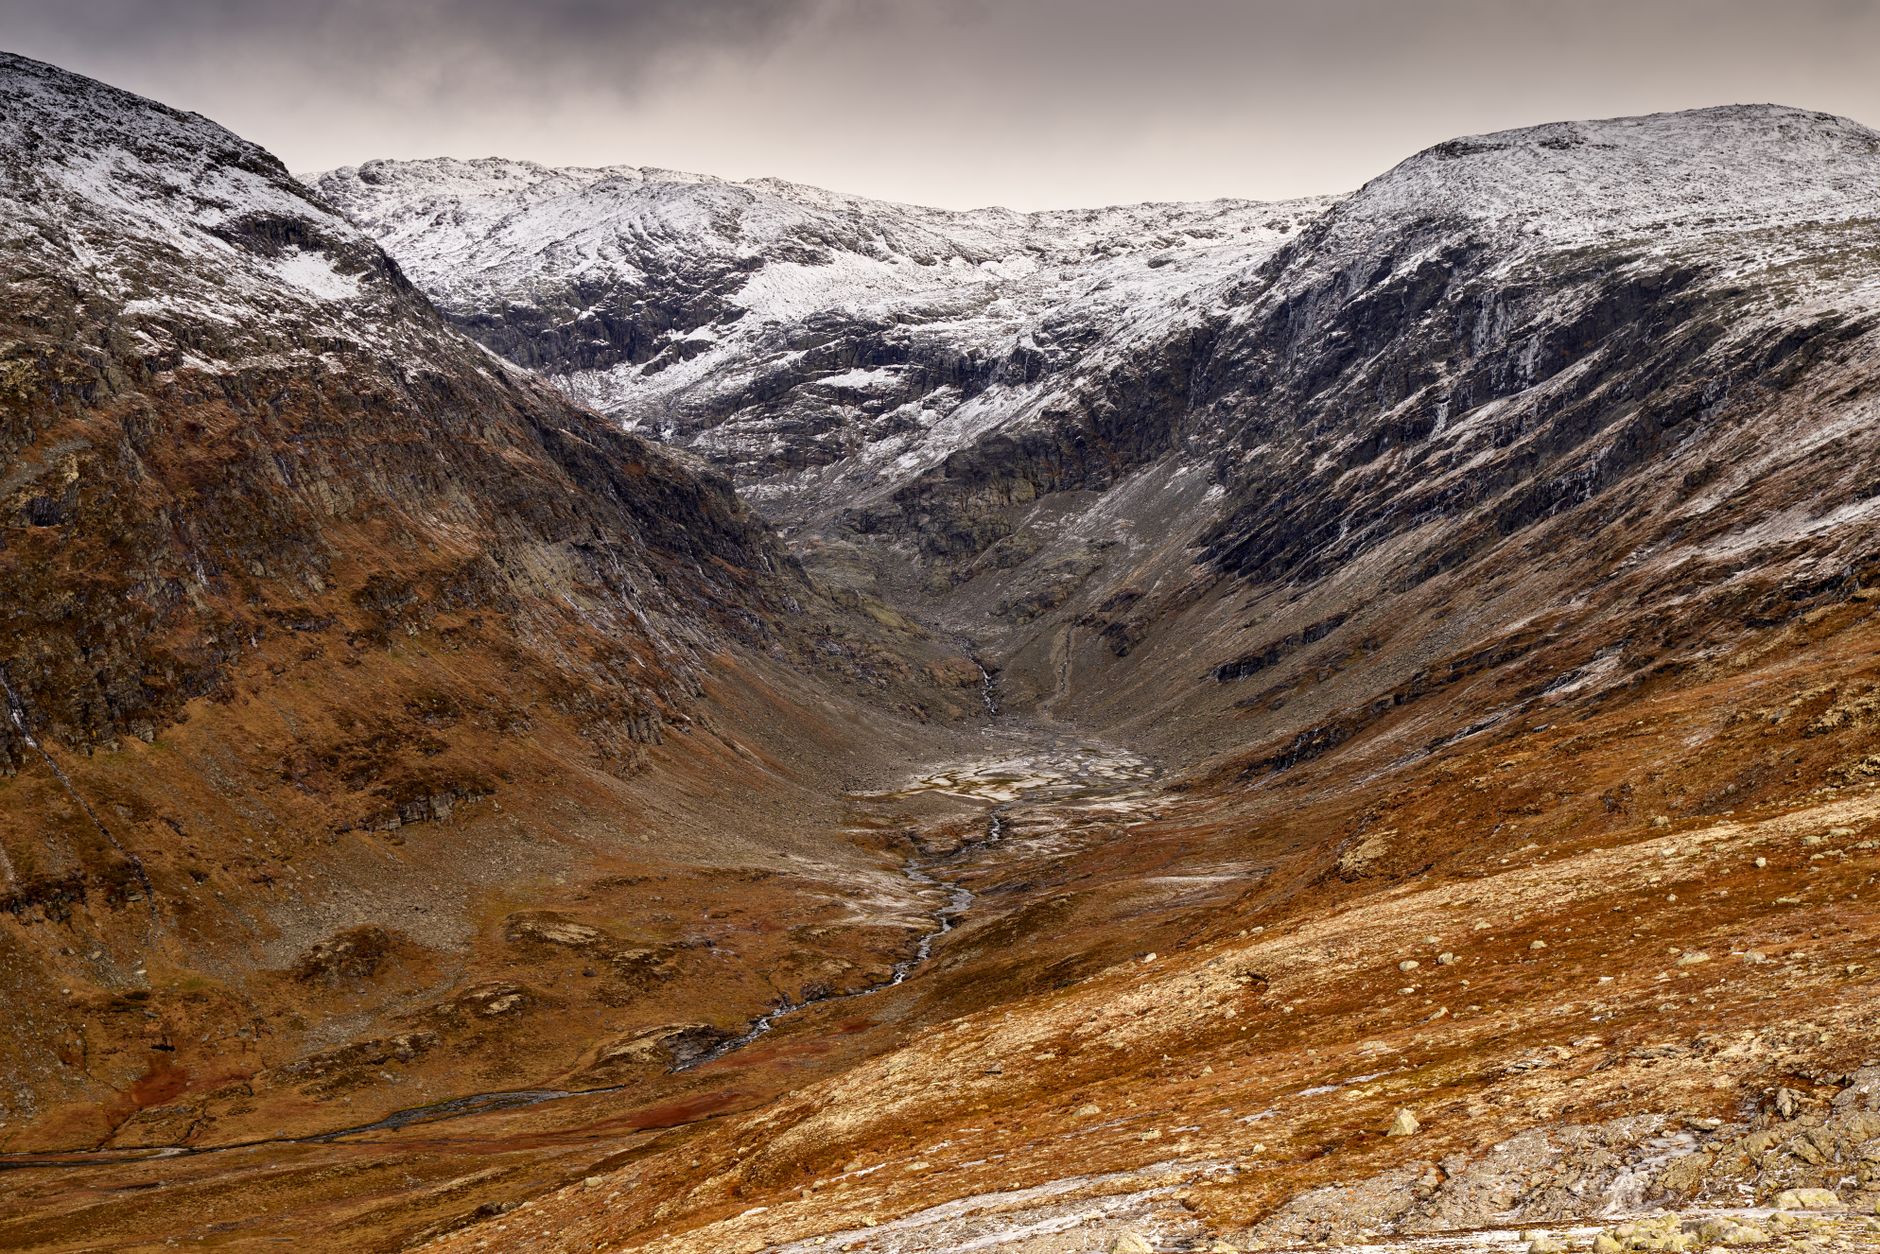
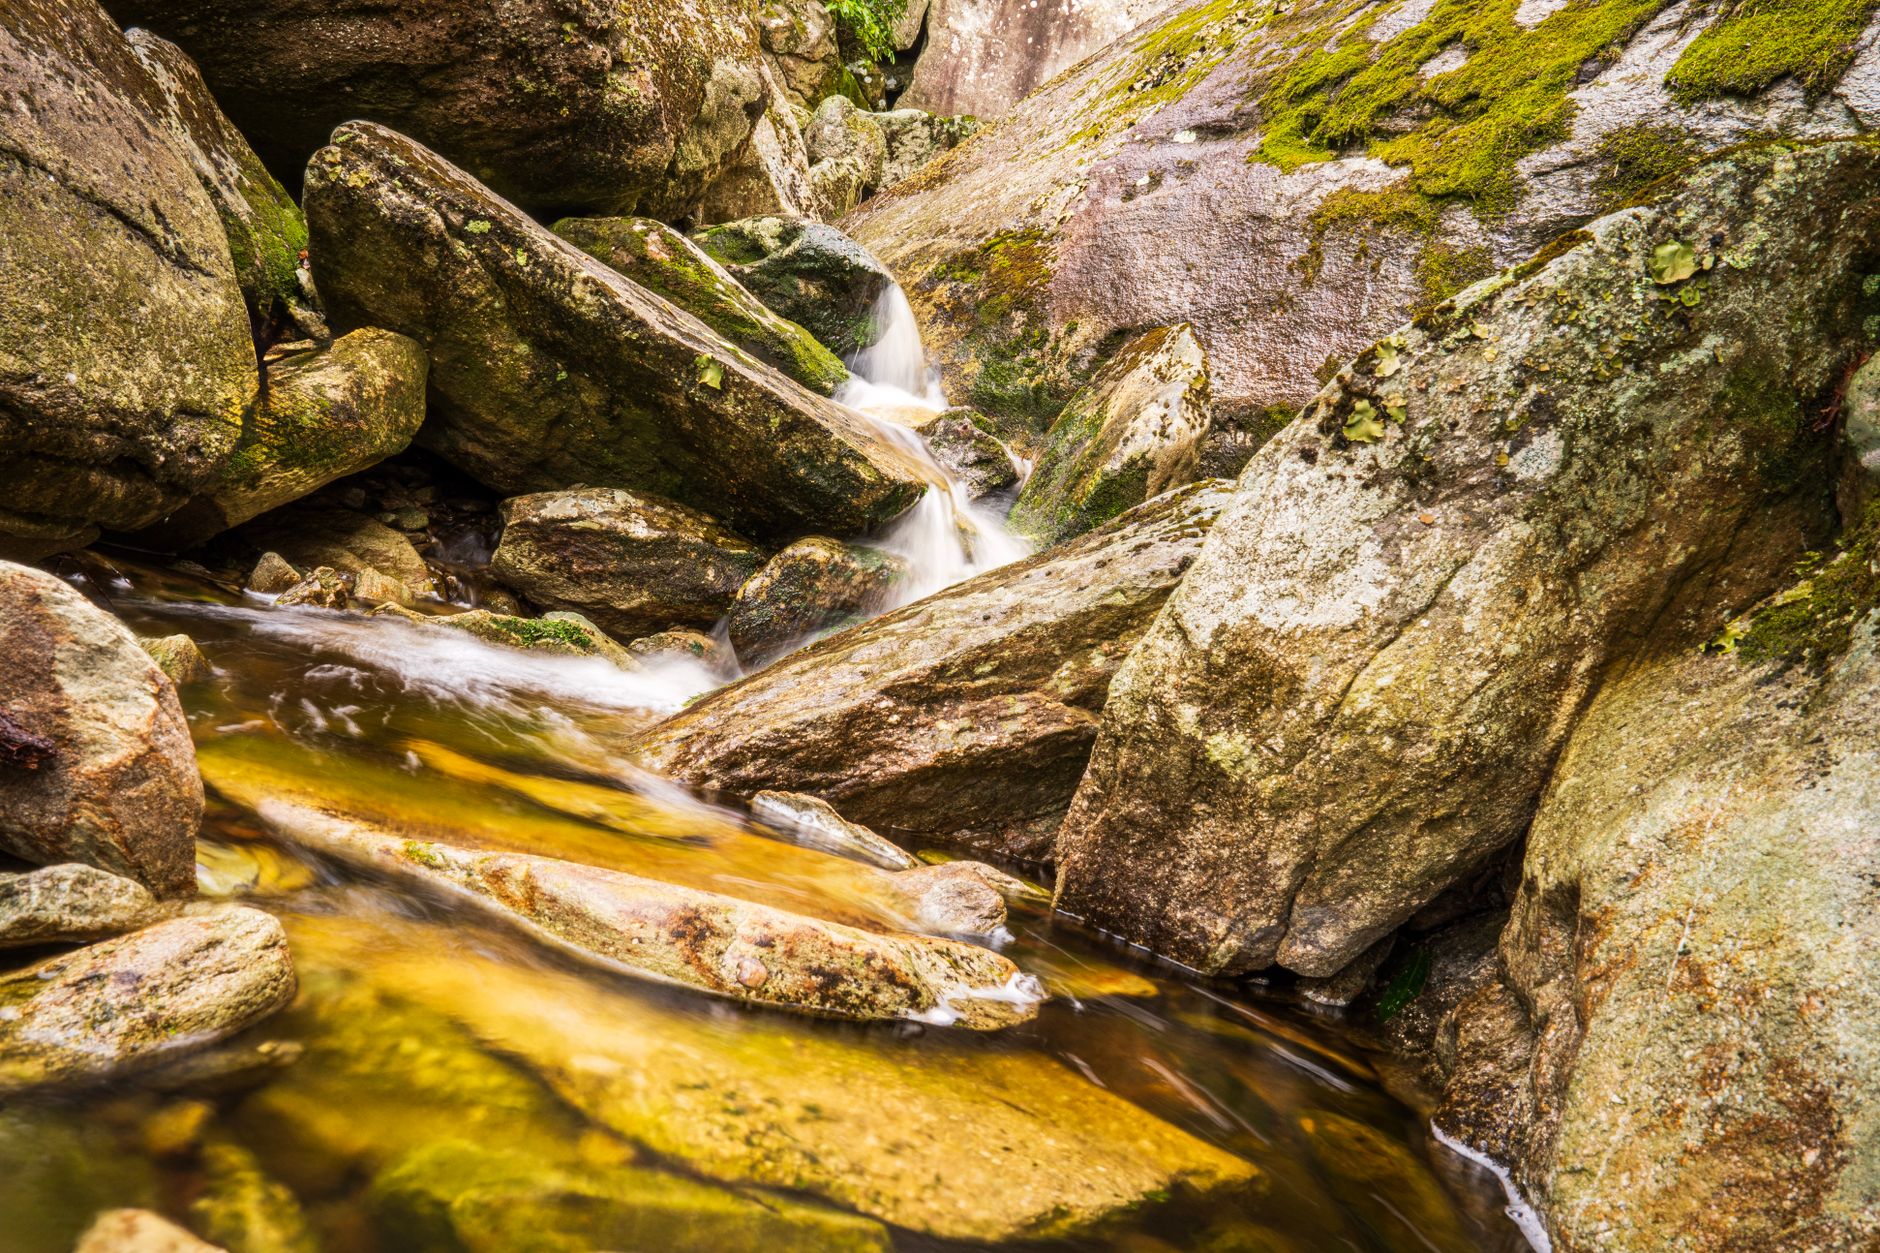
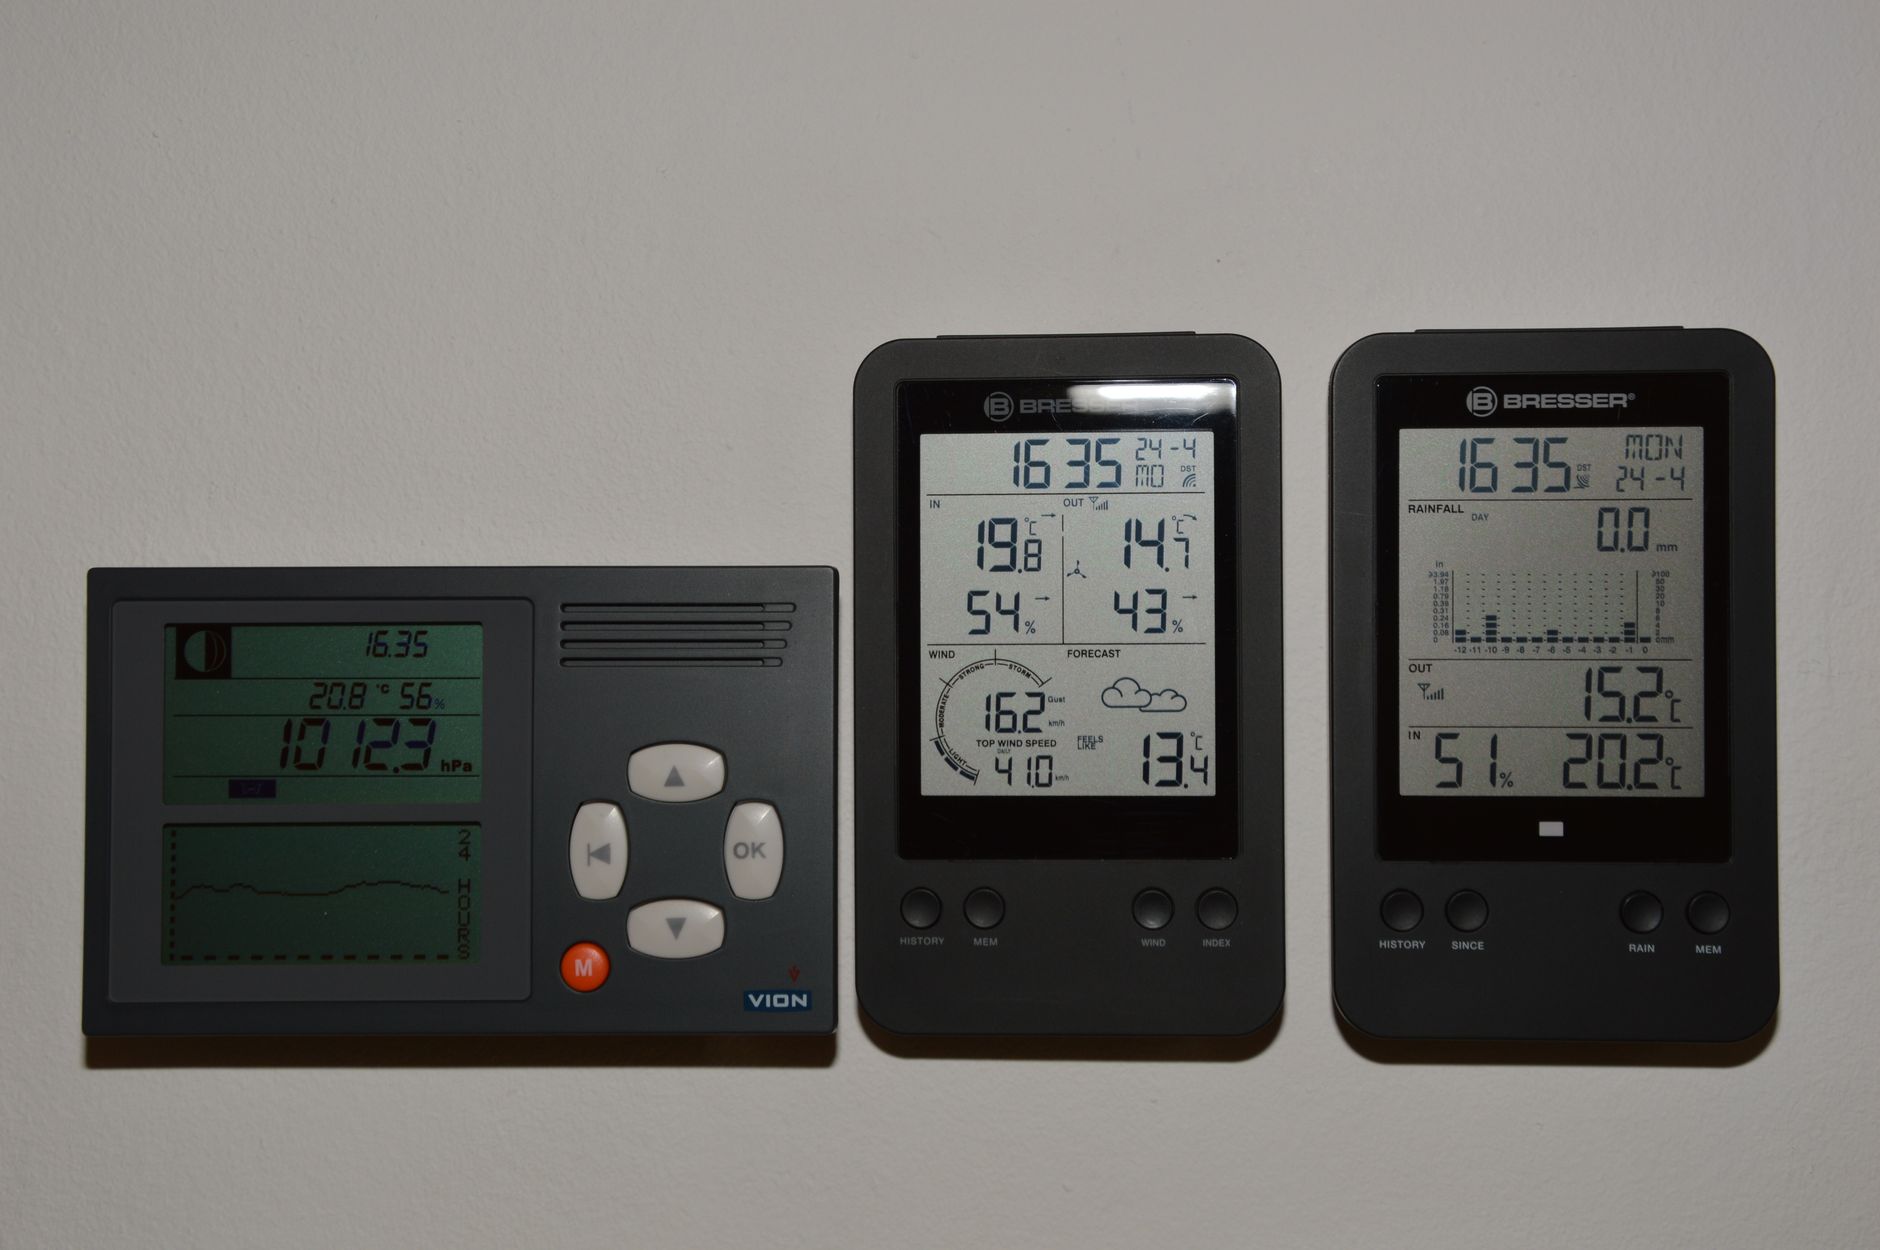
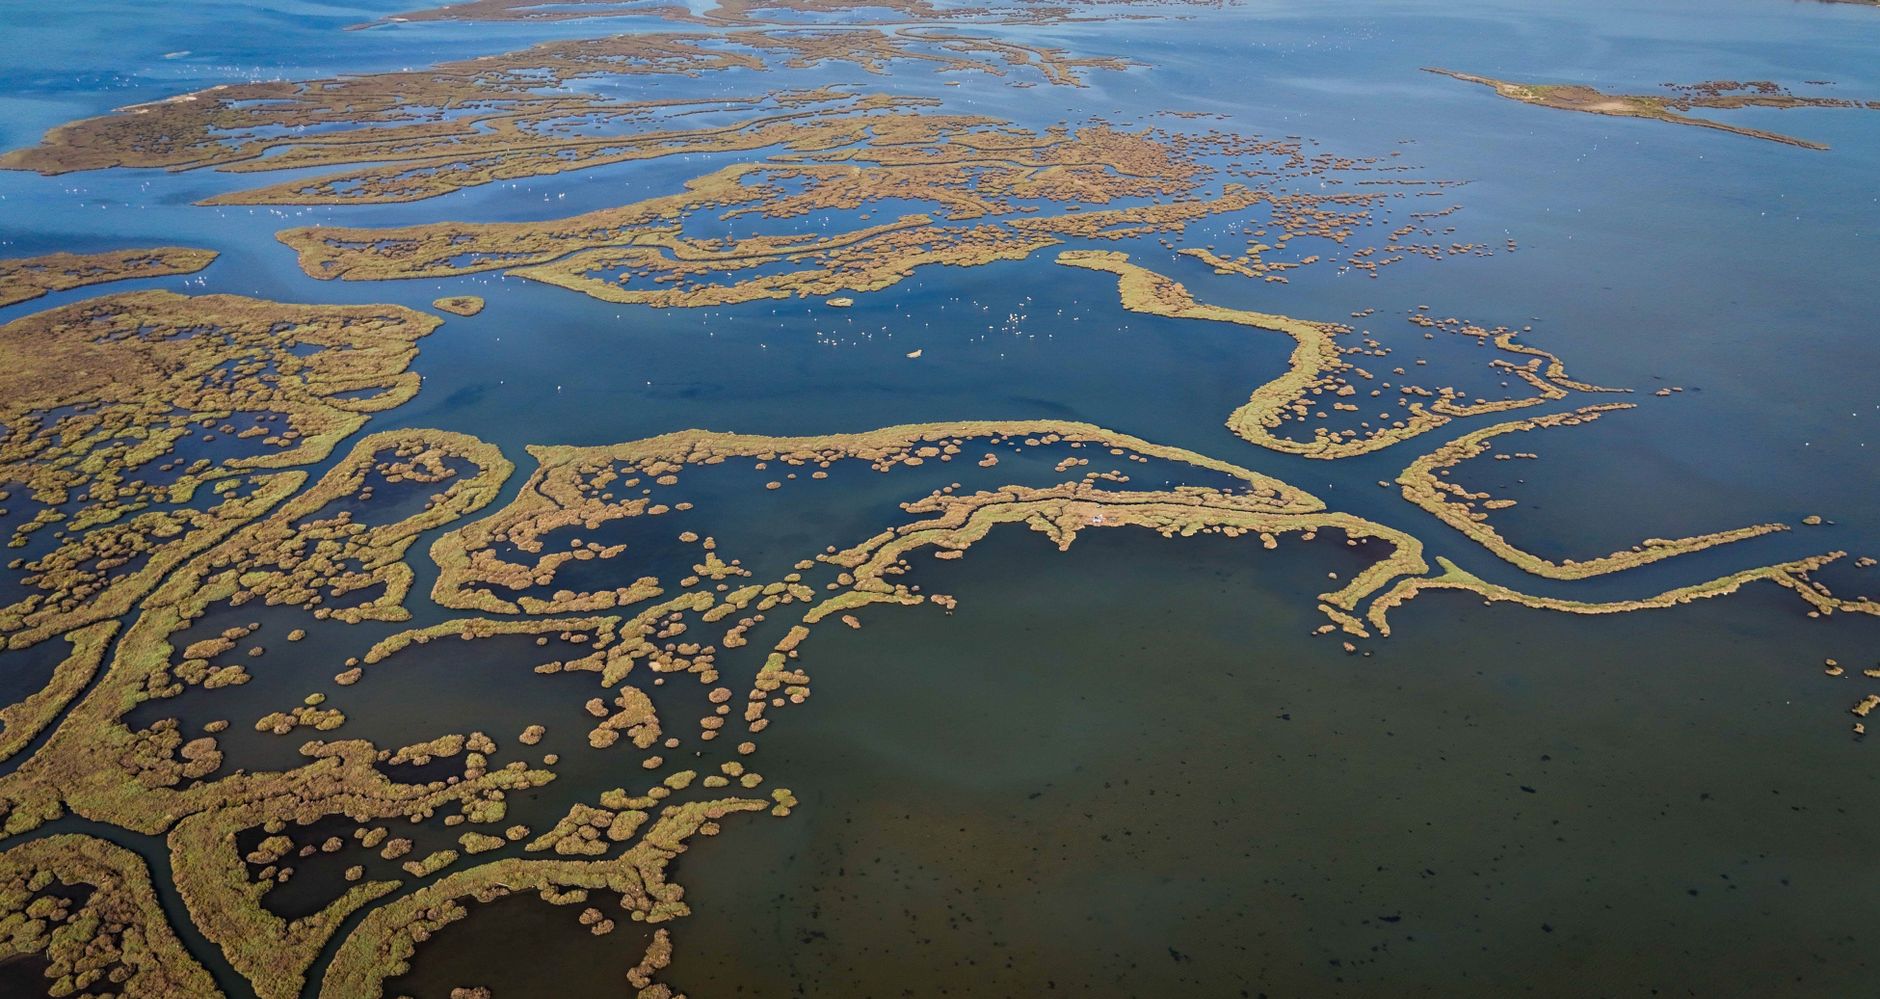
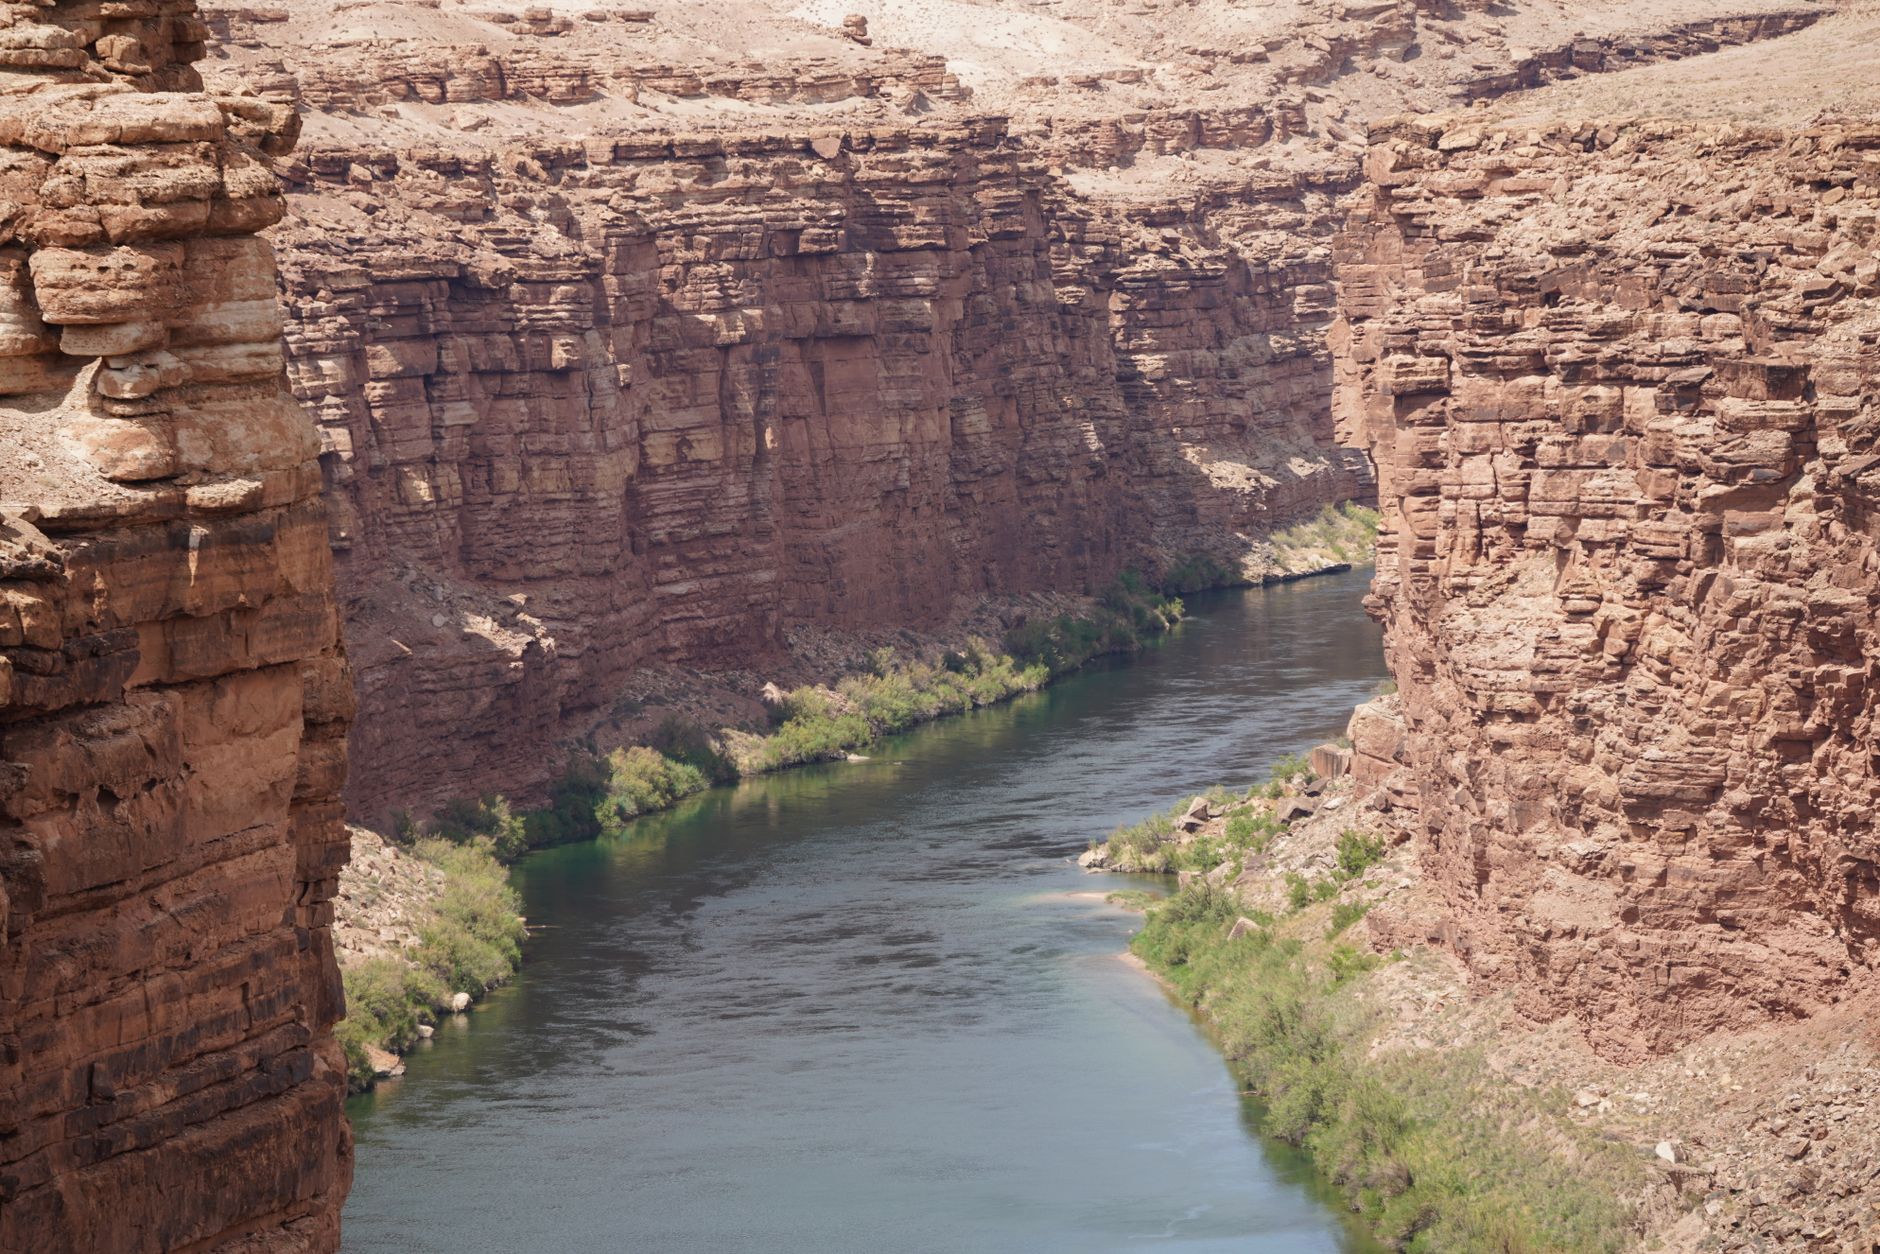
Contours and flowlines — one watershed, drawn live.
One river, one frame at a time.
Every basin is four rivers at once.
A spring seeps out of a hillside and the basin is born.
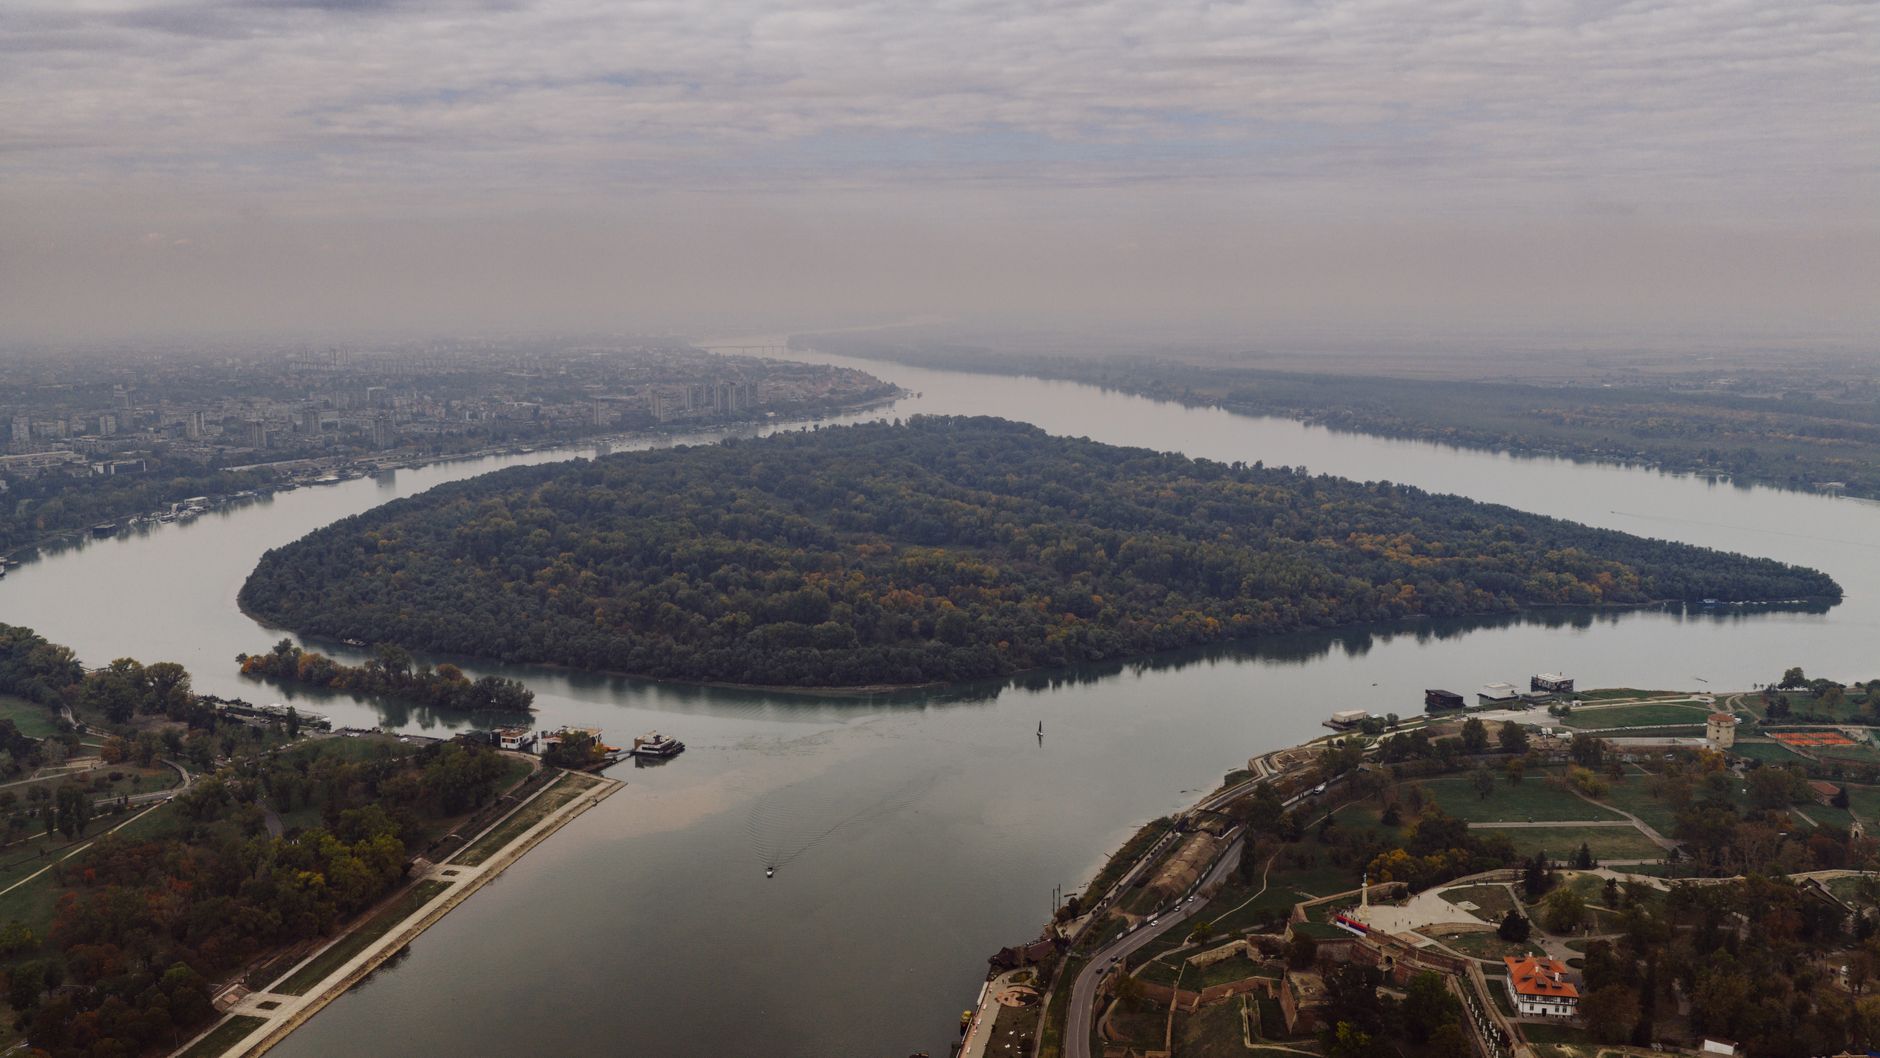
A creek gives itself to a river at the confluence.
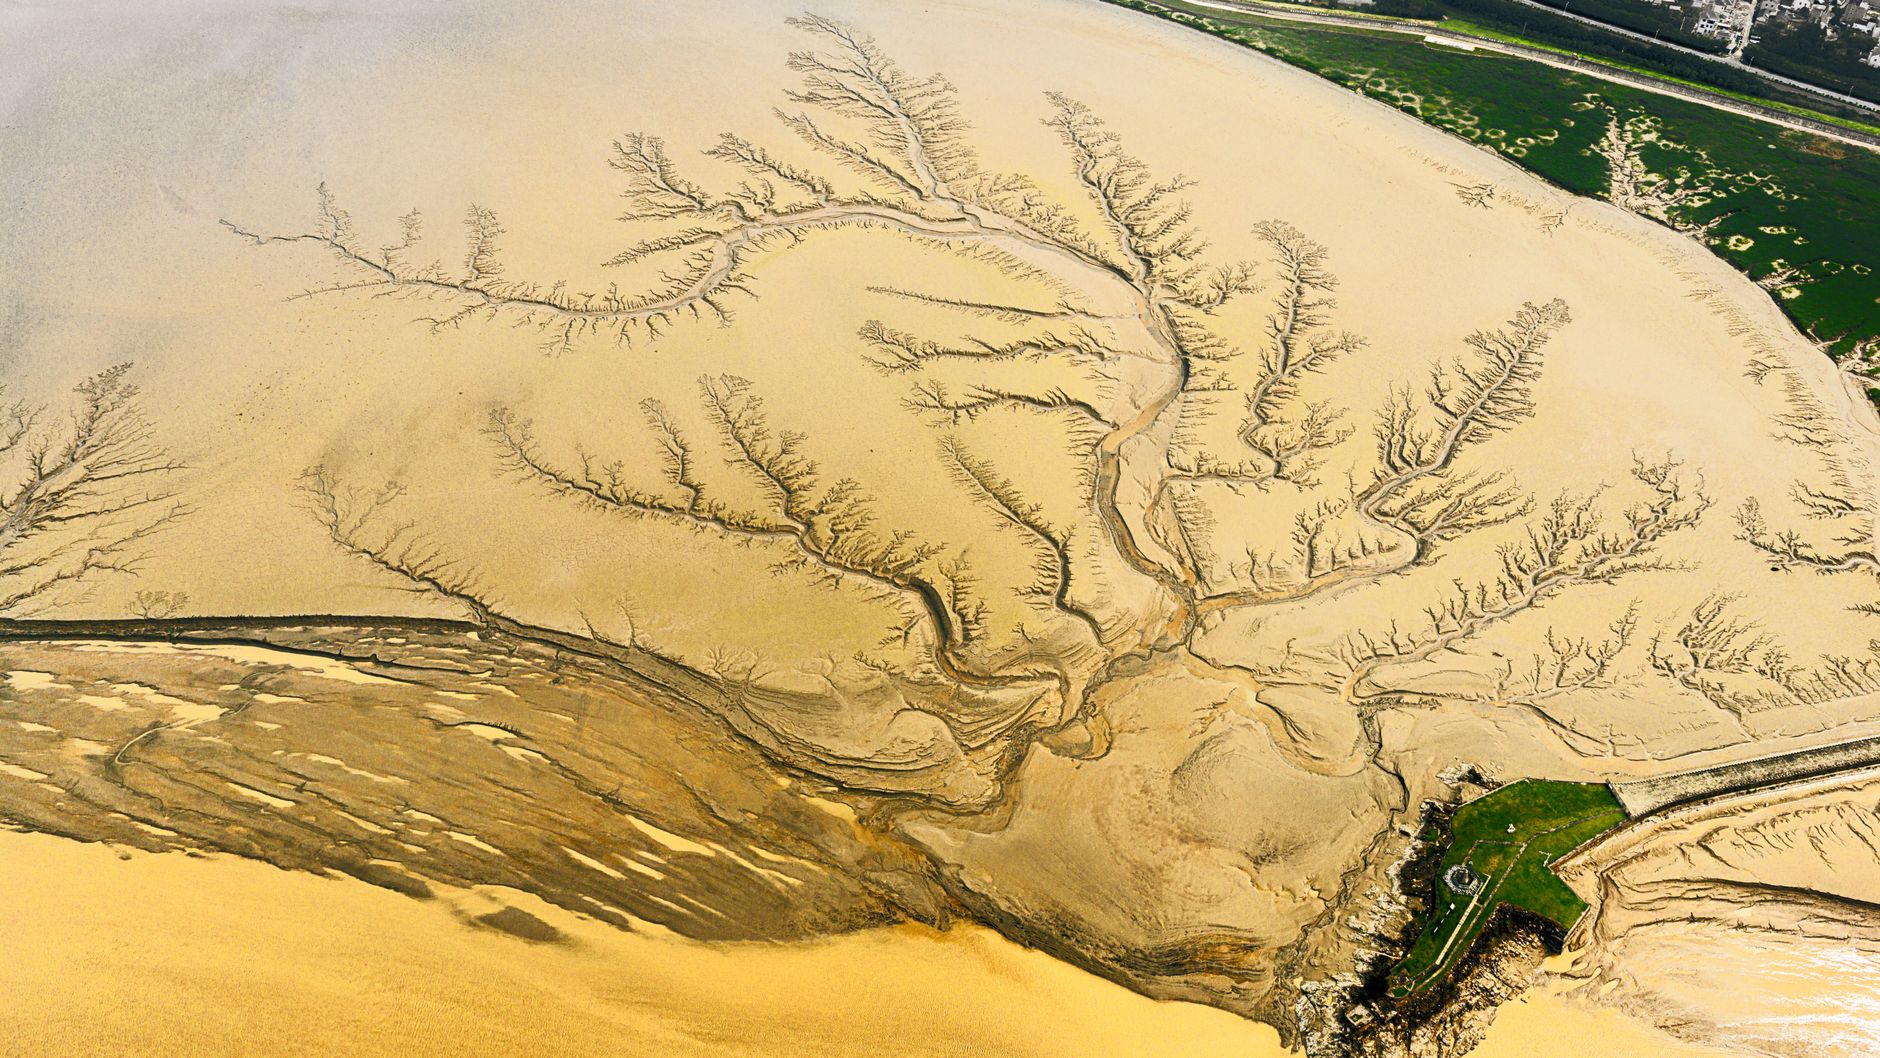
Fresh water rides over salt at the estuary.
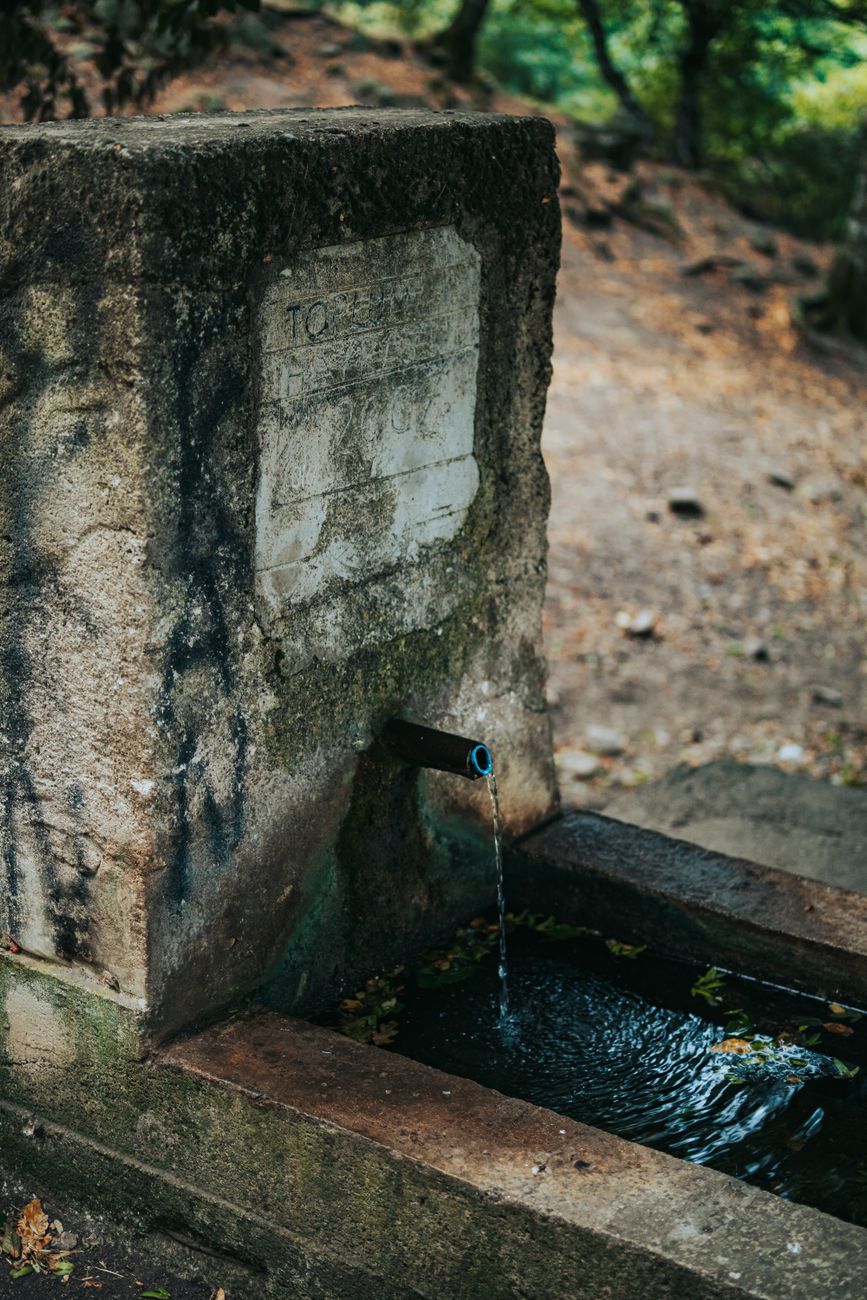
The aquifer returns to the light, cold and slow.

I learned to read a river the summer I was sixteen, standing in a stilling well my grandfather built. He kept a notebook — daily stage, in pencil, for forty-one years. He never missed a day. When he died, the notebook went to the county, and I never saw it again.
That's why basin exists. A gauge is a promise to keep reading, and a record is a promise to keep remembering. We digitize the notebooks, wire the gauges, and publish it all open — so no one's river quietly disappears into a county filing cabinet.
Every drop drains. But first it's measured, and then it's remembered. That's the whole product.
Live, from our backend.
Gauge keepers, hydrologists, and water districts.
"I've watched this gauge for thirty seasons. Basin is the first tool that reads the river the way I do — in the morning, before the trucks."
"The watershed map is absurdly good. I can trace a drop from snowpack to sea and see every station it passes on the way."
"We replaced six spreadsheets with one API call. The river didn't notice, but my team did."
Where the water goes next.
Watershed map + live gauge network, in public beta.
Community sensor program opens — deploy a station, fill a gap.
Groundwater modeling, joined to the surface network.
Flood forecasting, basin-wide, from the same open data.
every drop drains.